“Just wait, it'll get cheaper.” Everyone has heard it — but is it true? We didn't have to guess: our database holds real price histories for products people have been tracking for months. So we did the maths.
The result: a 35 % swing is normal
We analysed 166 products with at least eight price measurements in euros, comparing each product's lowest and highest recorded price. Here's what came out:
- 35 % median swing — the typical product was at some point a third more expensive than at its low.
- €120 average gap between the high and the low.
- 74 % of products moved by at least 20 %.
- 37 % of products moved by at least 50 %.
In other words: for three out of four tracked products, timing decides at least a fifth of the price.
Four examples from real price histories
- Google Pixel 9 Pro XL (512 GB): between €806.99 and €1,579 — €772 apart (96 %). The classic pattern: launch price versus the price once a successor comes into view.
- Formovie Theater Premium 4K projector: between €2,299 and €3,499 — €1,200 apart (52 %).
- GELTEX Quantum Touch mattress: between €589.99 and €1,387.99 — €798 apart (135 %). Mattresses are notorious for permanent discounts off inflated list prices.
- Bosgame M5 mini PC: between €1,582.95 and €2,399.95 — €817 apart (52 %).
Why the swings are this large
- Launch premium. New electronics start high and drop noticeably over the first months.
- List-price games. Some categories carry a high RRP that is permanently “discounted”. The discount is real — the reference price isn't.
- Season and sales events. Prices move most around Black Friday, Prime Day and year-end — in both directions.
- Stock and competition. Large retailers reprice automatically several times a day; a low sometimes lasts hours.
What this means in practice
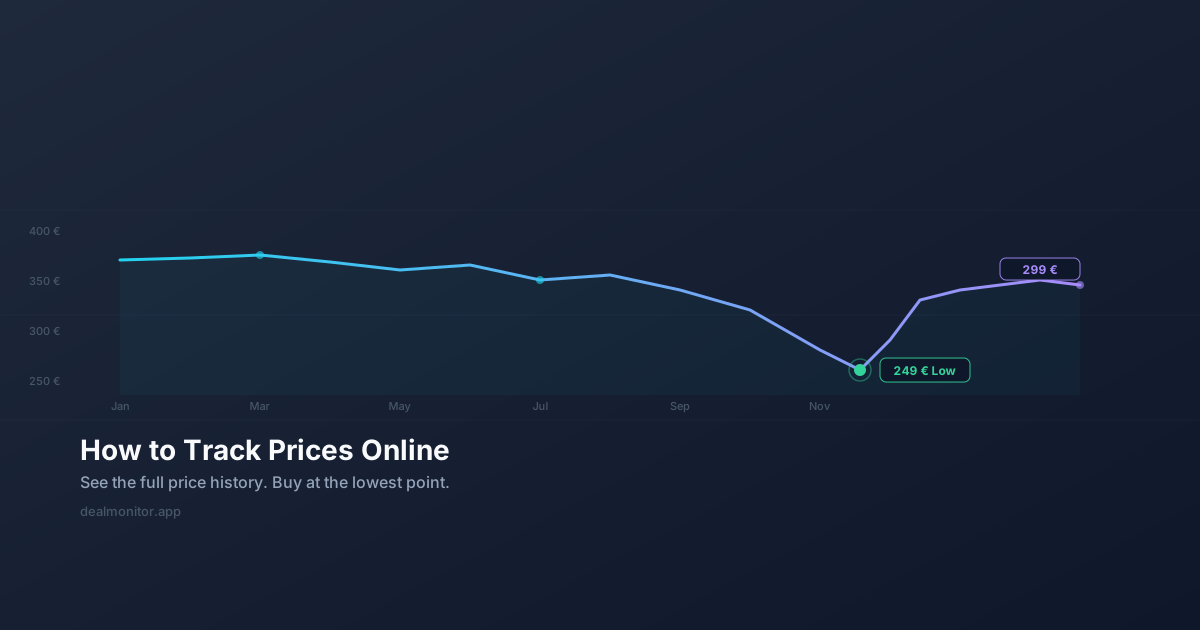
The wrong lesson would be “always wait”. Prices don't fall monotonically — a low is often followed by a rise, and chasing the absolute minimum means missing good moments.
- Set a target price instead of guessing. The past history shows what's realistic.
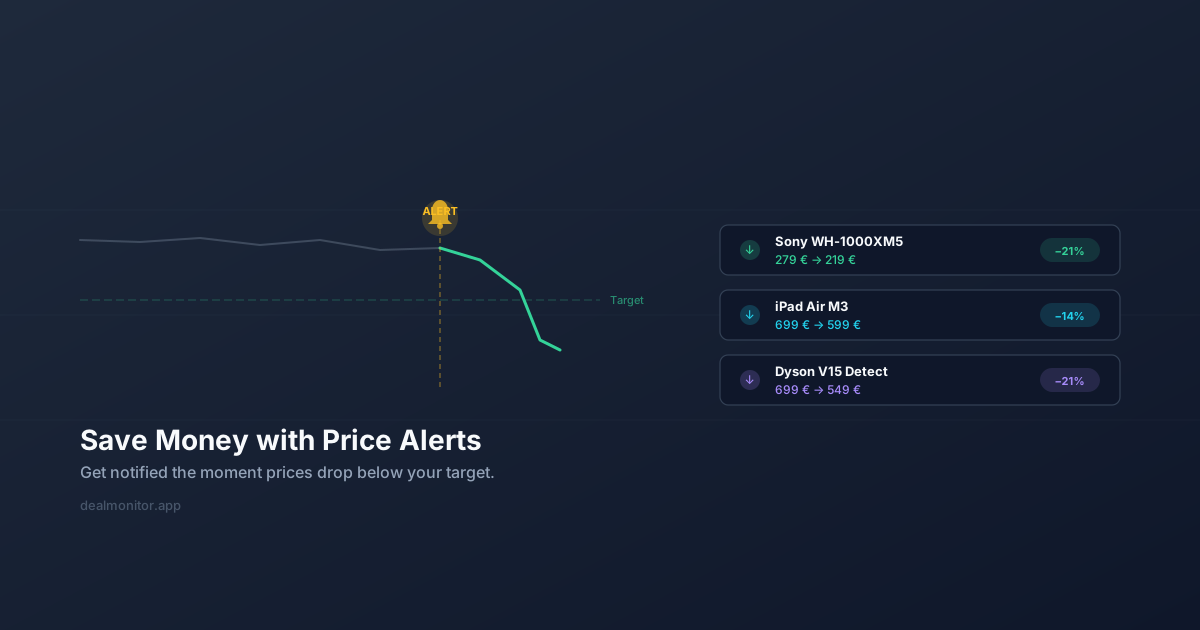
- Let it watch for you. Lows often last hours — that's what price alerts are for.
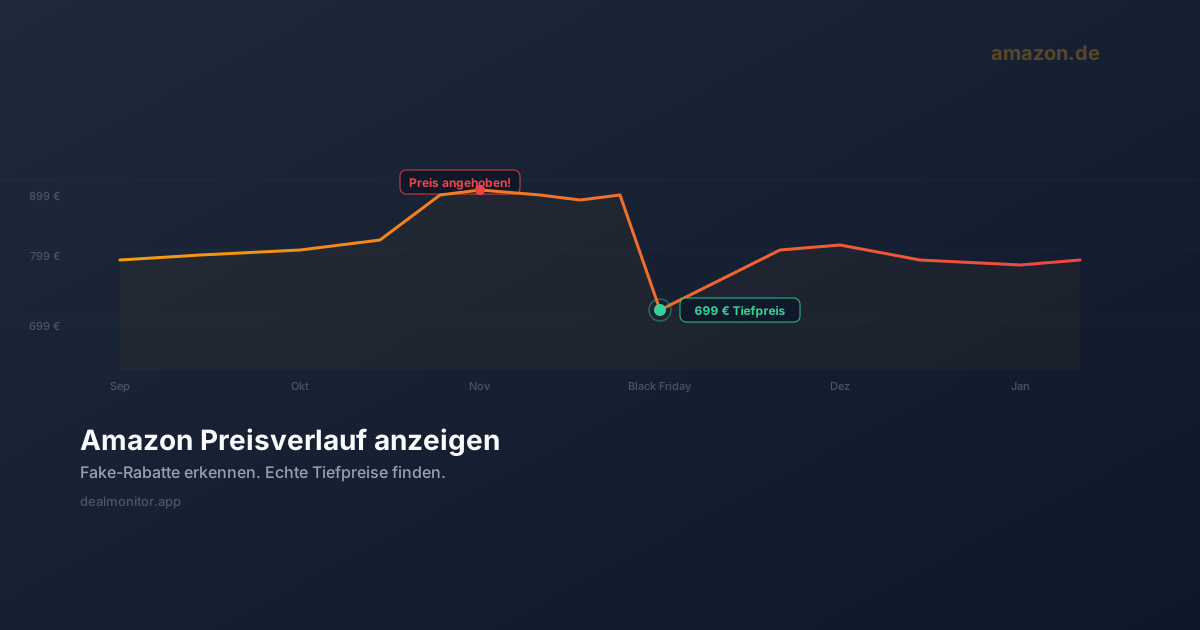
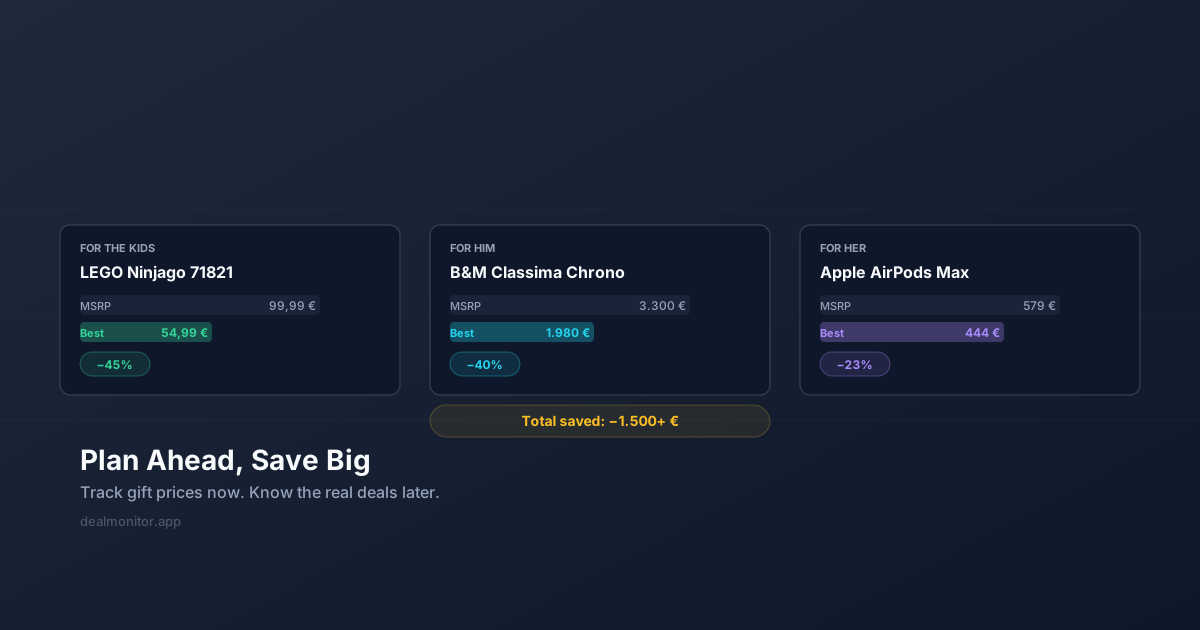
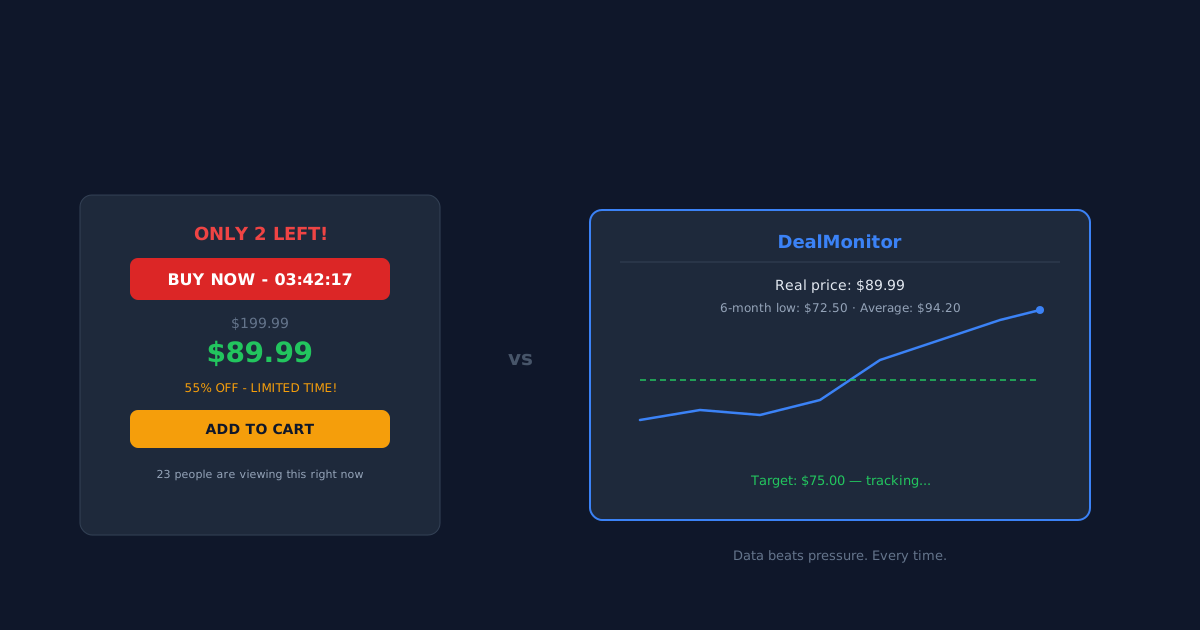
- Judge a discount against the history, not the RRP. “−40 %” means little if nobody ever paid the reference price.
We now publish the histories of many tracked products, including their low and high: price history of popular products.
How we calculated this
For transparency: we included products with at least eight price measurements in euros from shops we track regularly, comparing each product's lowest and highest recorded price. Swings above 200 % were excluded — in our experience such outliers stem from detection errors rather than real price jumps, and we would rather estimate conservatively than impressively. The sample reflects what our users actually track (electronics-heavy), so it is not representative of online retail as a whole.
Takeaway
Timing isn't a detail. For a typical tracked product, about 35 % — on average €120 — separates the best moment from the worst. You don't need to study charts daily: set a target price and let yourself be notified.